

Even though the topic and the main goal of today’s article is to describe what is likely to happen on the
gold market, we will start it with a chart featuring something else – it’s sister metal – silver. The reason is that the triangle-vertex-based reversal points are clearest in case of silver and since the entire precious metals sector is likely to move together, the above has implications for gold’s and mining stocks’ outlook as well. The above will be supplemented with gold’s seasonal analysis. Together, they’re forming a coherent picture of what awaits gold in the coming days.
Let’s dive into what silver is telling us right now.
Silver Throws Its Two Cents In
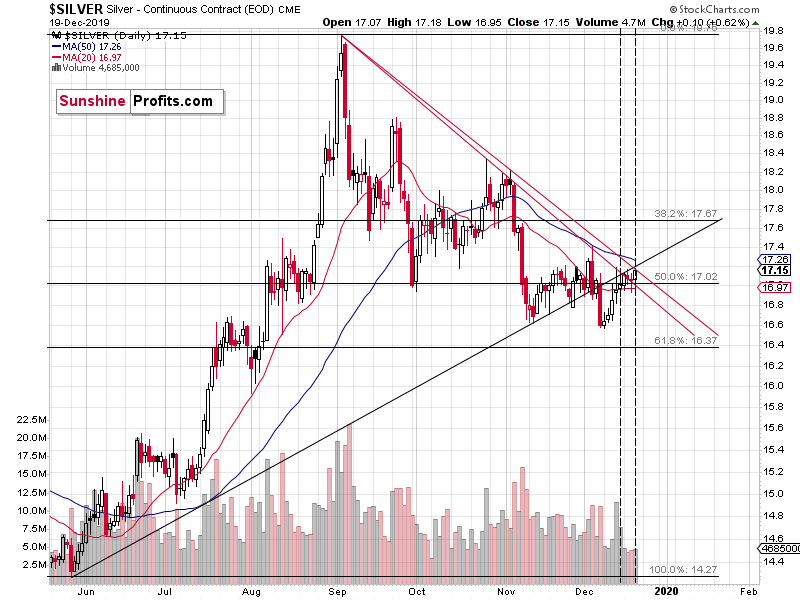
Silver confirms that it’s time for a change in the short-term trend. Silver has been moving up for several days and it approached its two triangle-vertex-based reversals. Silver formed an intraday high almost right at the first of the reversals and it matched this high during yesterday’s session. Silver also closed at a new very short-term high yesterday – it didn’t move to a new December high, though.
Silver is moving lower today (at least at the moment of writing these words), which suggests that both reversals indeed worked.
Reversals plus low volume could equal a big move lower shortly. There’s not much time for the decline to take place – probably next week – because of the current True Seasonal pattern and the long-term triangle-vertex-based reversals that we discussed previously.
The Seasonality’s Perspective
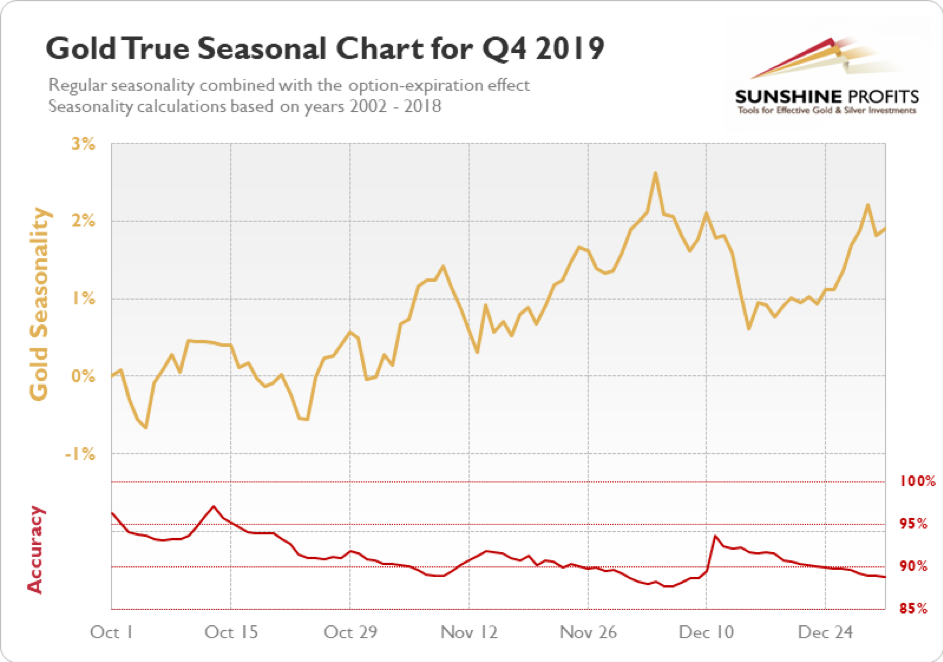
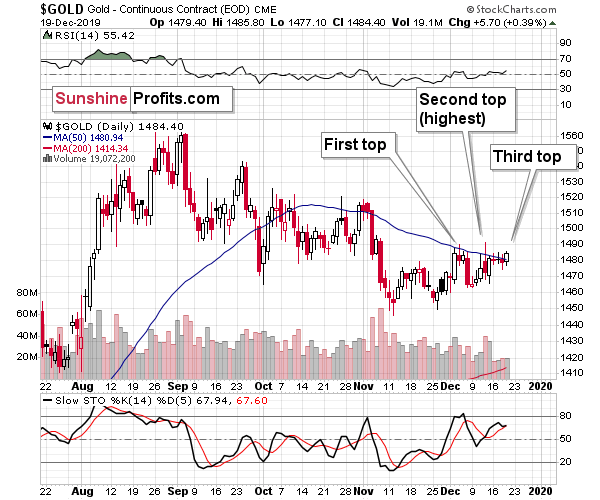
Usually, gold reports higher prices in the final quarter of the year, and if we consider the fact that gold closed September at $1,472.90, we see that it’s been true at least so far. Based on the seasonal tendencies, the yellow metal was supposed to decline in November, and that’s exactly what happened. Gold was supposed to then move higher and it did. It didn’t move above the November high, though. That doesn’t mean that the seasonality is useless – it simply means that since gold is now in a medium-term downtrend (considering highs, lows, and for instance the declining 50-day moving average), the implications might have a bit shifted, but they aren’t necessarily totally absent.
The above chart suggests three tops in the head-and-shoulders form, and that is indeed what gold formed.
What we just saw could have been the final of the three tops that is then likely (based on the seasonality alone) to be followed by the biggest decline of the quarter.
Now, taking seasonality at its face value, this is the time of the year when gold should be bottoming and preparing for its year-end rally. However, it seems that the patterns were delayed and since we have indications of upcoming reversals at the end of the year, it seems that we are still likely to see quite a volatile move lower before the next short-term corrective rally starts.
https://www.gold-eagle.com/article/gold-and-silver-price-forecasts-direct-cues-silver-chart-and-gold-seasonality
Комментариев нет:
Отправить комментарий